Introduction
This is a good setup if you want your system and docker logs to be monitored in Grafana.
Setup Directories
mkdir lokistack
mkdir lokistack/promtail
mkdir lokistack/loki
mkdir lokistack/grafana
Create a docker-compose file
Create a docker-compose.yml file in the lokistack directory with the following content:
version: "3"
networks:
  loki:
services:
  loki:
    container_name: loki
    image: grafana/loki:latest
    volumes:
      - ./loki:/etc/loki
    ports:
      - "3100:3100"
    restart: unless-stopped
    command: -config.file=/etc/loki/loki-config.yml
    networks:
      - loki
  promtail:
    container_name: promtail
    image: grafana/promtail:latest
    volumes:
      - /var/log:/var/log
      - ./promtail:/etc/promtail
    # ports:
    #   - "1514:1514" # this is only needed if you are going to send syslogs
    restart: unless-stopped
    command: -config.file=/etc/promtail/promtail-config.yml
    networks:
      - loki
  grafana:
    container_name: grafana
    image: grafana/grafana:latest
    user: "1000"
    volumes:
    - ./grafana:/var/lib/grafana
    ports:
      - "3000:3000"
    restart: unless-stopped
    networks:
      - loki
Configuring The Services
Loki
Create a loki-config.yml file in the lokistack/loki directory with the following content:
auth_enabled: false

server:
  http_listen_port: 3100
  grpc_listen_port: 9096

common:
  path_prefix: /tmp/loki
  storage:
    filesystem:
      chunks_directory: /tmp/loki/chunks
      rules_directory: /tmp/loki/rules
  replication_factor: 1
  ring:
    instance_addr: 127.0.0.1
    kvstore:
      store: inmemory

schema_config:
  configs:
    - from: 2020-10-24
      store: boltdb-shipper
      object_store: filesystem
      schema: v11
      index:
        prefix: index_
        period: 24h

ruler:
  alertmanager_url: http://localhost:9093
Promtail
Create a promtail-config.yml file in the lokistack/promtail directory with the following content:
server:
  http_listen_port: 9080
  grpc_listen_port: 0

positions:
  filename: /tmp/positions.yaml

clients:
  - url: http://loki:3100/loki/api/v1/push

scrape_configs:

# local machine logs
  - job_name: local
    static_configs:
    - targets:
        - localhost
      labels:
        job: varlogs
        __path__: /var/log/*log

# docker logs
  - job_name: docker
    pipeline_stages:
      - docker: {}
    static_configs:
      - labels:
          job: docker
          __path__: /var/lib/docker/containers/*/*-json.log


# syslog target
#- job_name: syslog
#  syslog:
#    listen_address: 0.0.0.0:1514 # make sure you also expose this port on the container
#    idle_timeout: 60s
#    label_structured_data: yes
#    labels:
#      job: "syslog"
#  relabel_configs:
#    - source_labels: ['__syslog_message_hostname']
#      target_label: 'host'
Docker Driver
If you want Loki to access the docker logs, you need to install the plugin, and edit the docker deamon.
docker plugin install grafana/loki-docker-driver:latest --alias loki --grant-all-permissions
Edit the docker deamon to use the plugin:
sudo nvim /etc/docker/daemon.json
{
  "log-driver": "loki",
  "log-opts": {
    "loki-url": "http://localhost:3100/loki/api/v1/push"
  }
}
Restart the docker deamon:
sudo systemctl restart docker
Grafana
You can access Grafana on http://localhost:3000 with the default credentials admin:admin. You can change the password by going to the settings.
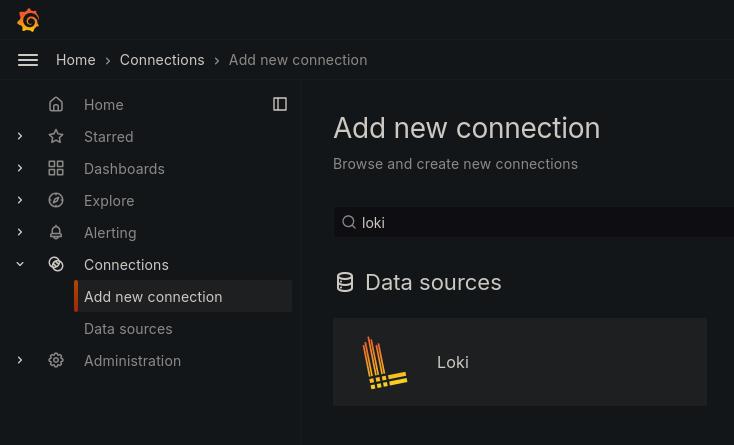
Adding Loki
Go to Connections -> Add new connection and add Loki:
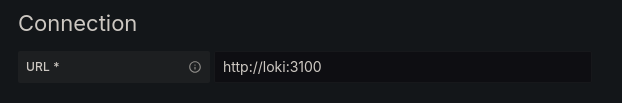
Then press Add new data source and set the Connection URL to http://loki:3100:
Checking the logs
You can check the logs by going to Explore and selecting the Loki data source, you can insert the query {} | logfmt to see the logs.